Download NHD Streamlines
Objectives:
- Use {
nhdplusTools} package to download and save basin and streamlines based on a location - Save out data into a
.geopackage
Working with Watershed Data
For folks who work in rivers and streams, an immensely useful R package for pulling hydrology data from NHD is {nhdplusTools}. This package provides access to NHD flowlines, attributes, and basin characteristics, all within an {sf} framework.
Let’s use this to grab some flowlines (riverlines), identify USGS gage stations within a basin, and save these out for a future analysis.
Loading Spatial Packages
Make sure you load the following packages.
# load packages or "libraries"
library(tidyverse) # wrangling/plotting tools
library(sf) # "simple features" spatial package for vector based data
library(nhdplusTools) # data from NHD
## USGS Support Package: https://owi.usgs.gov/R/packages.html#supportlibrary(mapview)
library(tmap)Download Basins based on USGS Gage
Here we can use the {nhdplusTools} package to grab watershed basin boundaries based on any USGS gage. You can find a map of USGS gages here.
For this example, we’ll use a gage on the South Fork American River, near Placerville, CA. This is Gage 11444500. Let’s break this into a few steps.
- The
nhdplusToolspackage needs alistthat identifies the type of data we’re looking for (here anwissite). This could also be a latitude and longitude starting point. For USGS sites, we also need to provide the ID for that site. - Once we have this information, we can do a few things. To download the basin upstream of a point or gage we can use the
get_nldi_basinfunction.
library(nhdplusTools)

# first identify the gage of interest: This on on the American
nldi_nwis <- list(featureSource = "nwissite", featureID = "USGS-11444500")

# next download the basin:
basin <- get_nldi_basin(nldi_feature = nldi_nwis)- The NHD dataset contains an immense amount of information, but it is built on various ID’s that can be linked. Every single stream segment in the US has a unique
COMIDwhich can be used. Let’s find theCOMIDassociated with theUSGS-11444500. Note, the CSCI data has a COMID column which makes it possible to download data via the COMID for each site.
# find out comid of the gage or point:
(comid_pt <- discover_nhdplus_id(nldi_feature = nldi_nwis))
## [1] 14982644Get Streamline Data
What’s really great is we can use a few different options to download NHD streamline info. Using either a gage ID, a COMID, or even a lat-long!
We also can specify whether we want upstream or downstream mainstem or tributaries. UT= “Upstream Tributaries”, UM=“Upstream Mainstem”, DM=“Downstream Main”, or DD=“Downstream Diversions”. We can also specify a distance we want to travel from that initial starting point. The default is 10km.
Here we pull downstream only from a CSCI COMID.
# use the comid to download streamlines U/S or D/S of the gage
# here downstream mainstem segments 50 km from the starting COMID
ds_main <- navigate_nldi(list("comid", "14983602"),
                                mode="DM",
                                distance_km =  50)

# let's see what downstream diversions look like:
ds_div <- navigate_nldi(list("comid", "14983602"),
                                mode="DD",
                                distance_km =  50)
mapview(ds_div, legend=FALSE) + mapview(ds_main, legend=FALSE)Here we pull upstream mainstem streamlines from a USGS Gage and a X/Y COMID.
# pull mainstems from a USGS gage
us_main <- navigate_nldi(nldi_feature = nldi_nwis,
                                mode="UM",
                                distance_km =  100)

# pull mainstems from an X/Y (lat/lon) point, needs to be st_sfc
xypoint <- st_sfc(st_point(c(-120.616, 38.81448)), crs = 4326)
xycomid <- discover_nhdplus_id(xypoint)

us_tribs <- navigate_nldi(
  nldi_feature = list(featureSource="comid", featureID=xycomid),
  mode="UT",
  distance_km = 20)
Find Additional Gages
Another great feature of nhdplusTools is the ability to search within the NHD network for additional NWIS sites. Let’s search upstream of USGS-11444500 for additional gages.
# find other upstream gages or NWIS sites
us_gages <- navigate_nldi(nldi_feature = nldi_nwis,
mode="UM",
data_source = "nwissite",
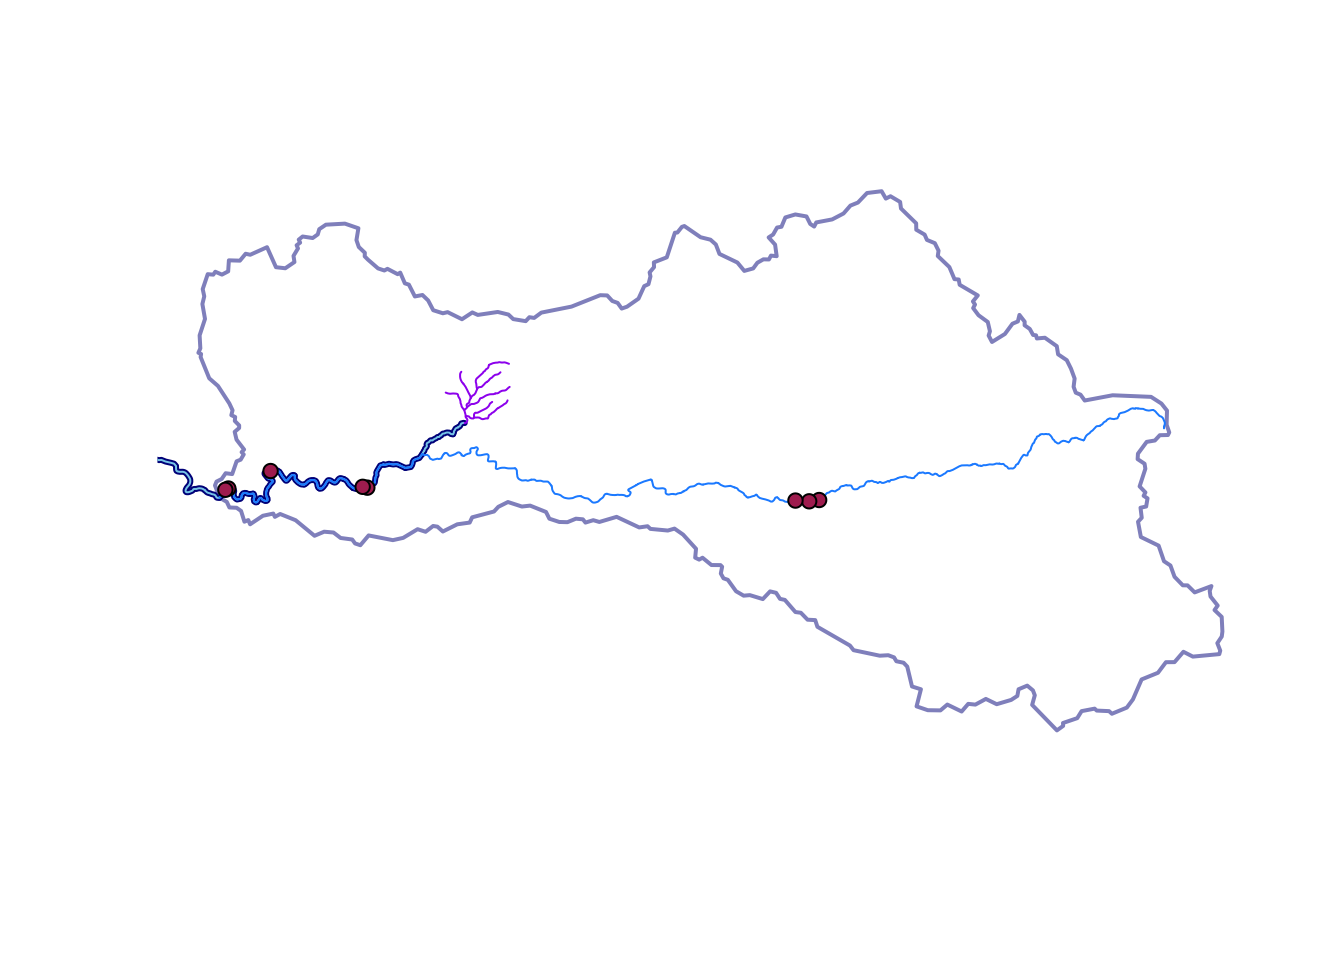
distance=100)We can plot this all together!
plot(basin$geometry, border = alpha("darkblue", alpha = 0.5), lwd=2)
plot(ds_main$geometry, col="darkblue", lwd=3, add=T)
plot(ds_div$geometry, col="skyblue", add=T)
plot(us_main$geometry, col="dodgerblue", add=T)
plot(us_tribs$geometry, col="purple", add=T)
plot(us_gages$geometry, bg="maroon", pch=21, add=T)