Joining Data
Objectives for this section:
- understand how to join datasets by shared columns or IDs
- have a general sense of the variety of join types
- join some data and save it
Joining Data
We often need to take several datasets and merge them into a single dataset that we can use for analysis. This “join” can at times be tricky, and can be made more so if we aren’t exactly sure what data matches up between the two datasets. Sometimes joining data can resemble more of a gridlock than a clean and seamless merge.

Figure 1: Merging Data? (source Wikipedia Commons)
Common Variables
The trick that makes this all possible, is having one or more shared pieces of data across the two (or more) datasets. This may be an ID column, or a specific observation or data type. Importantly, these data can actually have different column names, but they should be formatted in the same way across each dataset!
While this may seem daunting at first, it’s not! R has some excellent tools built into the {dplyr} package that make joining datasets fairly straightforward. First let’s import some data we can use to join. Here we will build off of the dataset we used in the previous lesson.
Let’s read in both the csci_clean and sites_clean datasets. If you recall, we saved these as .csv, .rds, .xlsx, and .rda. For now, let’s use the rda option as it will be fastest.
Challenge 1
- Read in the
csci_sites_clean.rdafile - How many rows are there in each object?
Click for Answers!
load("data/csci_sites_clean.rda")

nrow(csci_clean) # gives just the number of rows
## [1] 1612nrow(sites_clean) # gives just the number of rows## [1] 1613Inspect the Data
Let’s quickly take a look at the columns in our datasets and see what looks similar. To do this we can inspect our data with either head or names or str. All will tell us similar information.

Figure 2: Artwork by @allison_horst
str(csci_clean)## tibble [1,612 × 8] (S3: tbl_df/tbl/data.frame)
## $ SampleID_old : chr [1:1612] "000CAT148_8.10.10_1" "000CAT228_8.10.10_1" "102PS0139_8.9.10_1" "103CDCHHR_9.14.10_1" ...
## $ StationCode : chr [1:1612] "000CAT148" "000CAT228" "102PS0139" "103CDCHHR" ...
## $ COMID : num [1:1612] 8942501 8942503 23936337 22226836 22226634 ...
## $ E : num [1:1612] 16.1 16.1 15.5 21.1 16.8 ...
## $ OE : num [1:1612] 0.931 0.973 1.09 1.09 1.078 ...
## $ pMMI : num [1:1612] 1.045 0.99 1.054 1.083 0.916 ...
## $ CSCI : num [1:1612] 0.988 0.981 1.072 1.087 0.997 ...
## $ SampleID_old.1: chr [1:1612] "000CAT148_8.10.10_1" "000CAT228_8.10.10_1" "102PS0139_8.9.10_1" "103CDCHHR_9.14.10_1" ...str(sites_clean)## tibble [1,613 × 3] (S3: tbl_df/tbl/data.frame)
## $ StationID: chr [1:1613] "000CAT148" "000CAT228" "102PS0139" "103CDCHHR" ...
## $ lat : num [1:1613] 39.1 39.1 42 41.8 41.9 ...
## $ lon : num [1:1613] -120 -120 -123 -124 -124 ...What do we see? Looks like we have the same data type in the StationID column in sites_clean and the StationCode column in csci_clean. They are just named differently.
Join Types
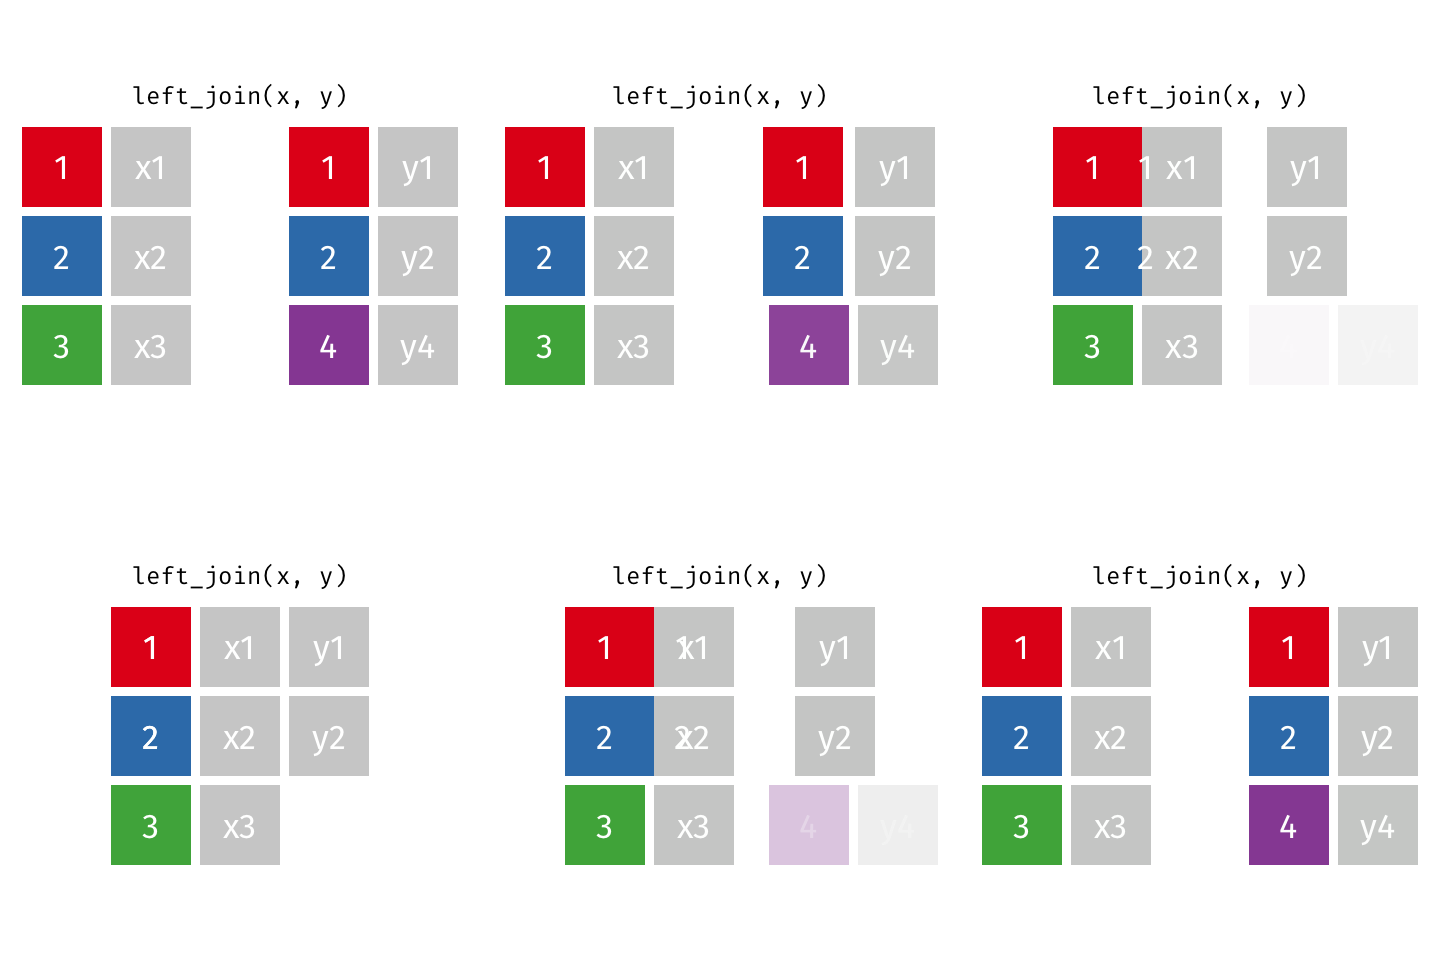
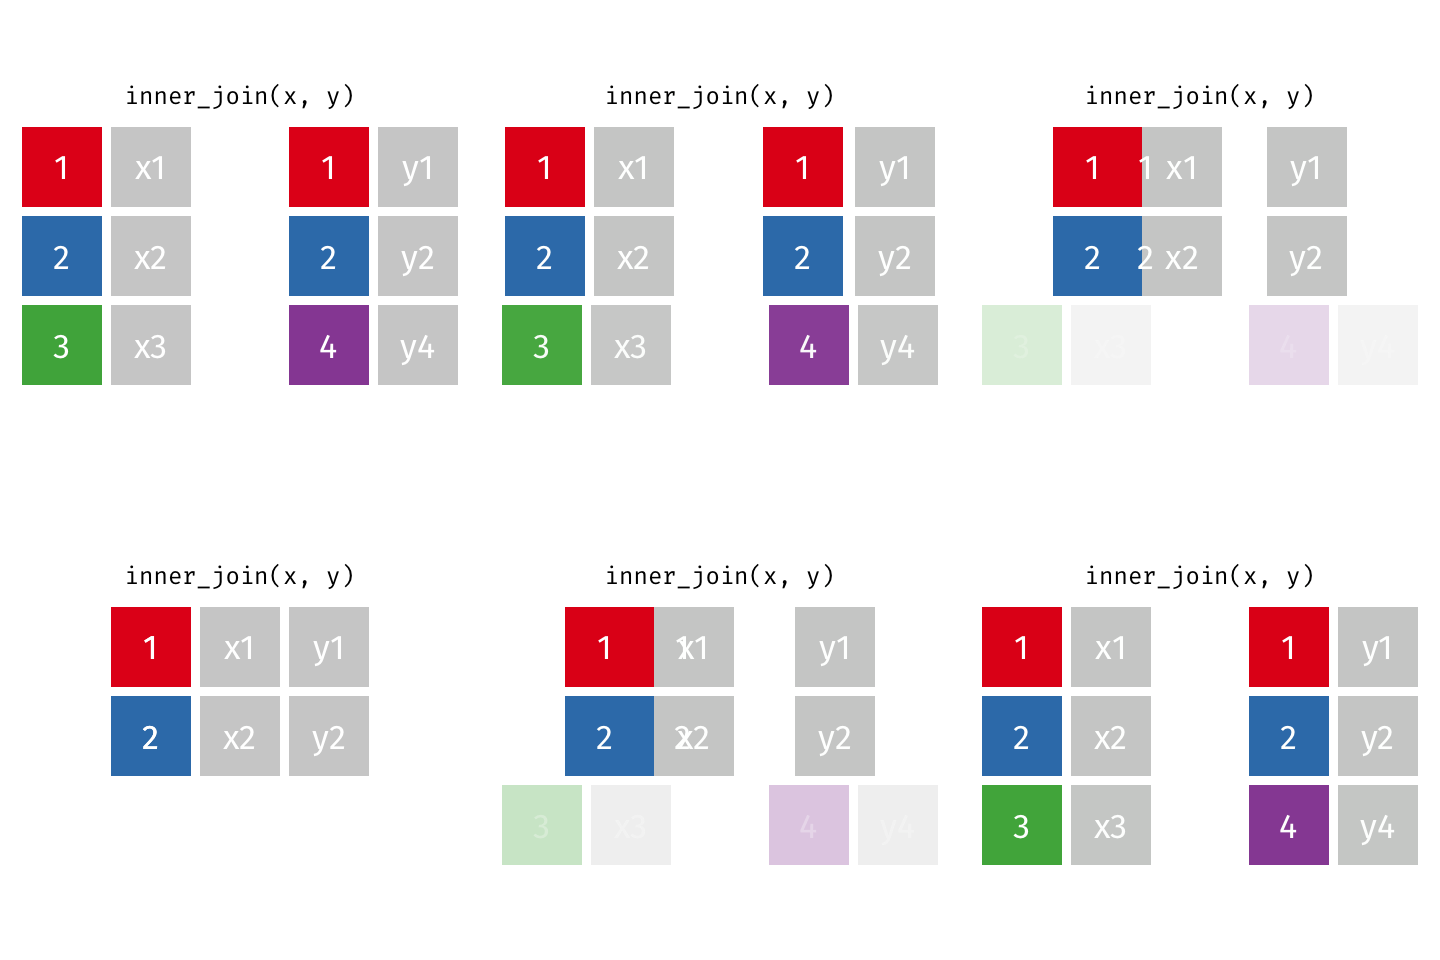
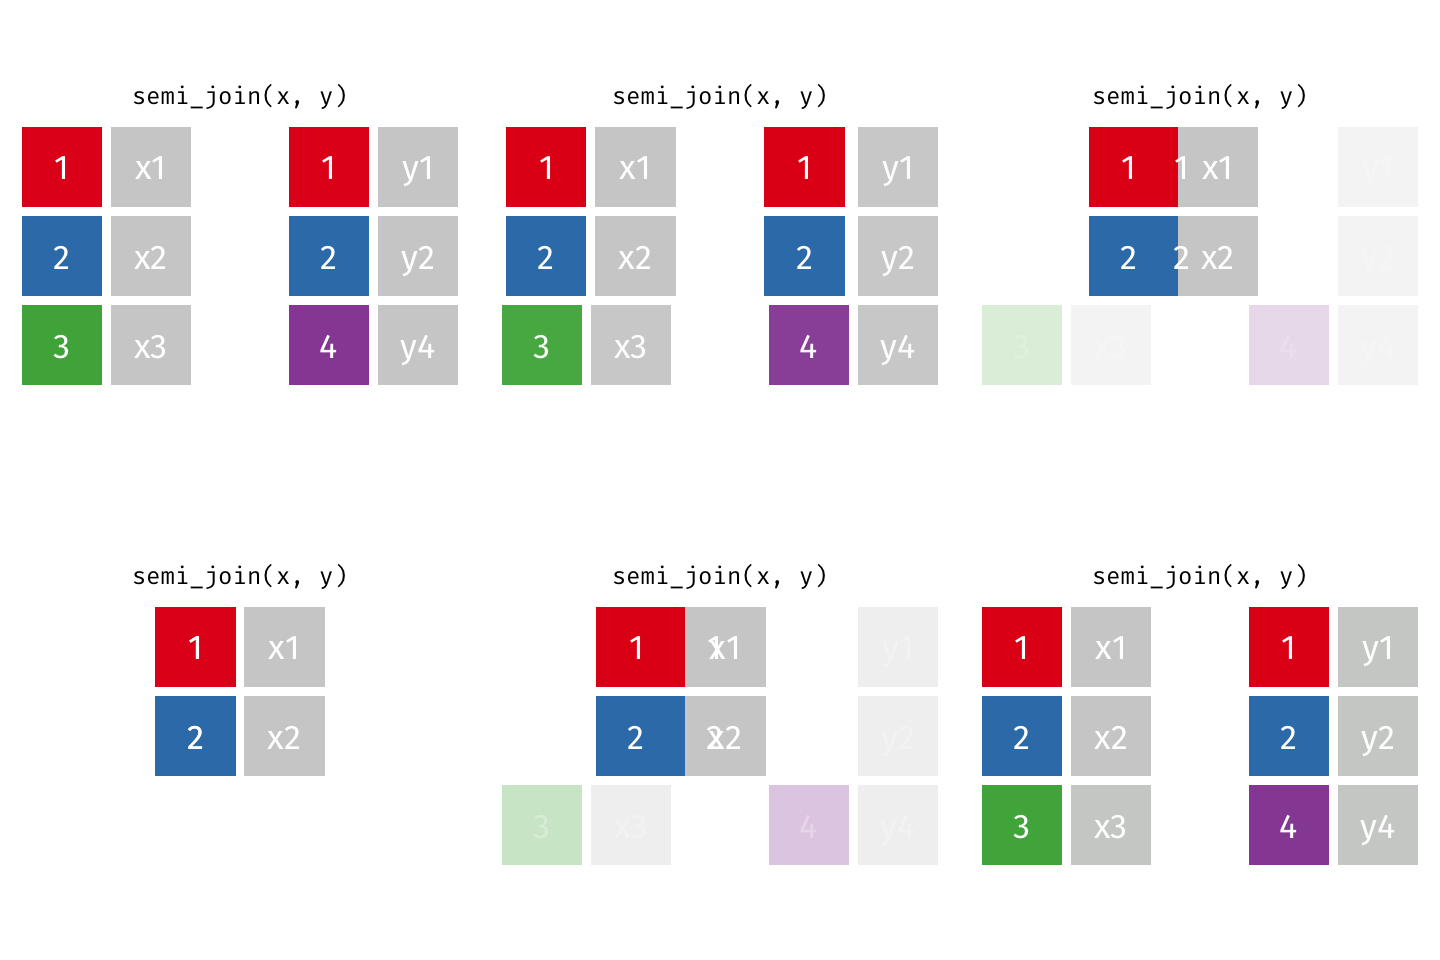
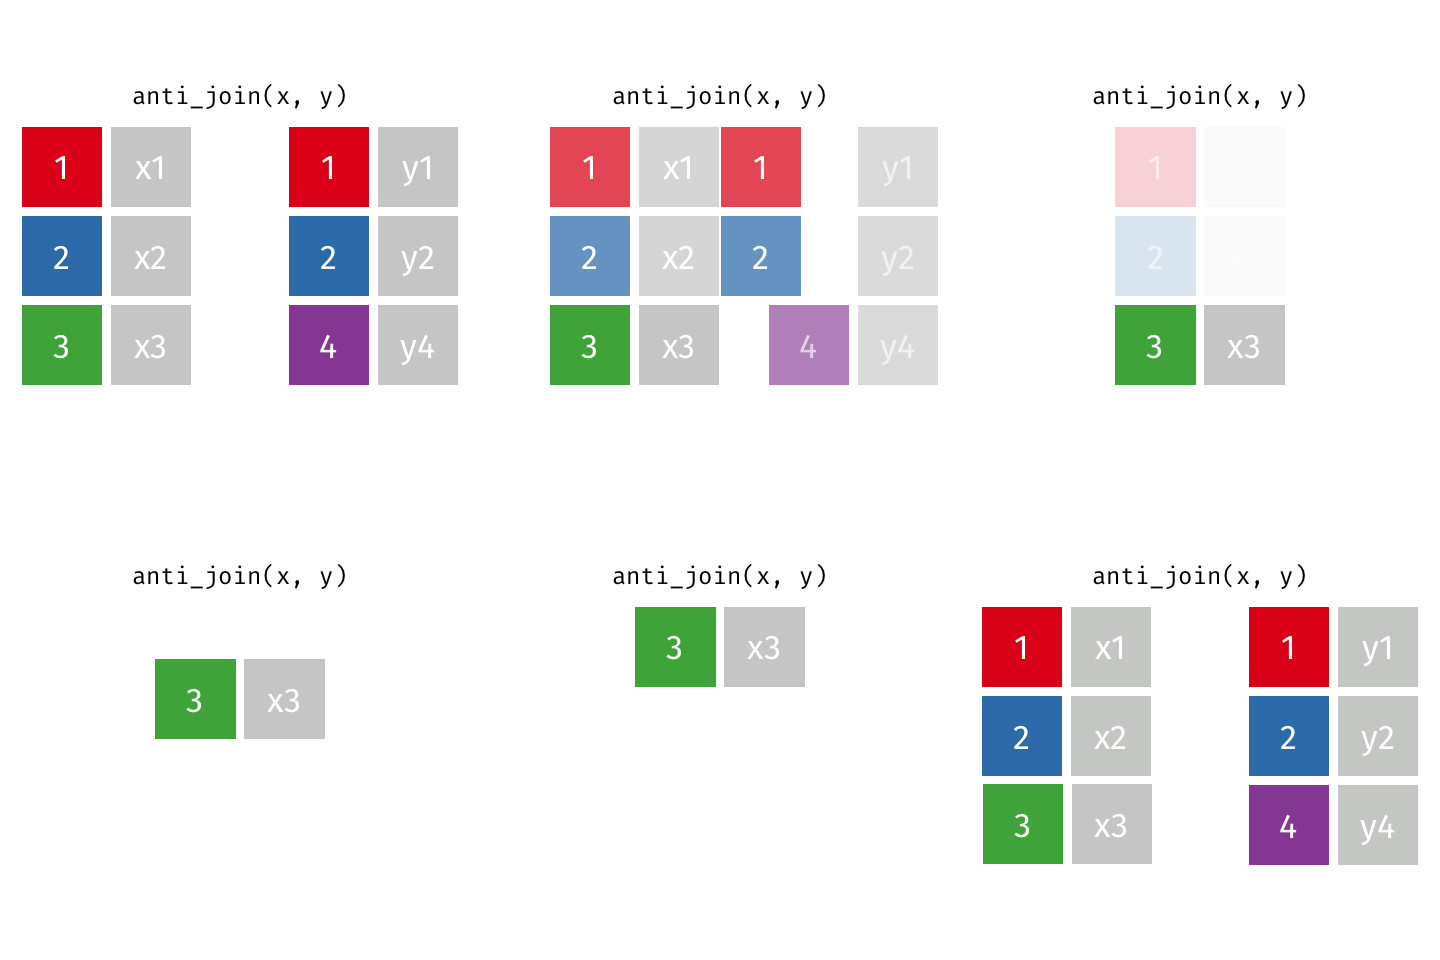
There are quite a few different join types that are available via the {dplyr} package. Here are some great animations by Garrick Aden-Buie that may help illustrate the various join types.
Left Join
All rows from x, and all columns from x and y. Rows in x with no match in y will have NA values in the new columns.

Inner Join
All rows from x where there are matching values in y, and all columns from x and y.

Full Join
All rows and all columns from both x and y. Where there are not matching values, returns NA for the one missing.

Semi Join
All rows from x where there are matching values in y, keeping just columns from x. Also known as a filtering join because you are basically filtering one dataframe, using another dataframe as the match.

Anti Join
Also a filtering join. This keeps all rows from x where there are not matching values in y, keeping just columns from x. Really handy to find out which data is not joining, or may be missing from one or both datasets.

Join Our Data
For our purposes, let’s assume we have some data (our CSCI data: csci_clean) that we want to make a map of to visualize things. But the site information (sites_clean) is in a separate dataframe or file! This happens all the time. Databases keep different tables, and to avoid redundancy in data, there may be one table that just has site location information and maybe a description of each site, and a table where the actual data collected at the site lives.
Let’s join our site table with our CSCI table to make a single dataset that contains both the scores for our bioassessment data, and our site localities. This will help us plot and map the data later. Remember to keep track of how many rows and columns we have in each of our datasets.
Let’s use an inner_join() here, because we only want to keep sites that have matching Site ID codes between the CSCI data and the Sites data. If the join column (our Site ID) is named the exact same in each table, this is easy. We could use something like this:
# load dplyr package
library(dplyr)

# join data by common column: same name
csci_sites_match <- inner_join(csci_clean, sites_clean)
Error: `by` must be supplied when `x` and `y` have no common variables.
ℹ use by = character()` to perform a cross-join.
Run `rlang::last_error()` to see where the error occurred.Uh-oh. But look! This error message is pretty descriptive, it tells us the two pieces we are working with (x=csci_clean and y=sites_clean) don’t have a common column name (or variable). Then it gives us a suggestion, use by = character(). Let’s try that and see what it looks like!
# join data by common column: different name
csci_sites_match <- inner_join(csci_clean, sites_clean,
                               # now the by, remember x col first, then y
                               by=c("StationCode"="StationID"))

# now we have lat and lon in our dataframe with the data!
str(csci_sites_match)
## tibble [1,612 × 10] (S3: tbl_df/tbl/data.frame)
## $ SampleID_old : chr [1:1612] "000CAT148_8.10.10_1" "000CAT228_8.10.10_1" "102PS0139_8.9.10_1" "103CDCHHR_9.14.10_1" ...
## $ StationCode : chr [1:1612] "000CAT148" "000CAT228" "102PS0139" "103CDCHHR" ...
## $ COMID : num [1:1612] 8942501 8942503 23936337 22226836 22226634 ...
## $ E : num [1:1612] 16.1 16.1 15.5 21.1 16.8 ...
## $ OE : num [1:1612] 0.931 0.973 1.09 1.09 1.078 ...
## $ pMMI : num [1:1612] 1.045 0.99 1.054 1.083 0.916 ...
## $ CSCI : num [1:1612] 0.988 0.981 1.072 1.087 0.997 ...
## $ SampleID_old.1: chr [1:1612] "000CAT148_8.10.10_1" "000CAT228_8.10.10_1" "102PS0139_8.9.10_1" "103CDCHHR_9.14.10_1" ...
## $ lat : num [1:1612] 39.1 39.1 42 41.8 41.9 ...
## $ lon : num [1:1612] -120 -120 -123 -124 -124 ...Great! But what about the site that didn’t join? What if we want to find out which one it was, so we can figure out why, or go collect data there?
The Anti Join
Let’s use an Anti-join and quickly look at the sites that didn’t match. Notice, sites_clean has the extra record, so we need to list it first and figure out what was missing.
anti_join(sites_clean, csci_clean,
          by=c("StationID"="StationCode"))
## # A tibble: 1 x 3
## StationID lat lon
## <chr> <dbl> <dbl>
## 1 205R00154 37.2 -122.Notice we had to list both sites_clean first, as well as the sites_clean stationID column first.
Challenge 2
- If we switched the objects we used in the
anti_join(as above in the originalinner_join), R would return zero records. Why?
Click for Answers!
Because the csci_clean has 1612 records, and the sites_clean has 1613 records, and all the csci records joined when we used the inner_join, there are no records in csci_clean that didn’t join with the sites_clean. So R will return zero records!
Save it Out!
Remember how to do this? Let’s save this as a .RData file for now.
# list our data object, and then the filepath and name
# remember to use a relative path!
save(csci_sites_match, file = "data/csci_sites_match.rda")
Great work! Let’s move to the next lesson.